Insight into United States public debt
Posted on October 5, 2011
Filed Under Analysis_and_predictions, Business, Economy, Investment, Leadership, essential_Information | Leave a Comment
Insight into United States public debt
Original source from Wikipedia, the free encyclopedia (http://en.wikipedia.org/wiki/United_States_public_debt)

Recent additions to the public debt of the United States
Comments from Martin Chu:
This is the very fundamental and critical information that every American should well understand and think it through carefully!
How it happened, Why it happened, When it happened and then
The last one is the most important!
God bless America!
_______________________________
The United States public debt is the money borrowed by the federal government of the United States at any one time through the issue of securities by the Treasury and other federal government agencies. The US national public debt consists of two components:
Debt held by the public comprises securities held by investors outside the federal government, including that held by investors, the Federal Reserve System and foreign, state and local governments.[1]
Intragovernment debt comprises Treasury securities held in accounts administered by the federal government, such as the Social Security Trust Fund.
The public debt increases or decreases as a result of the annual unified budget deficit or surplus. The federal government budget deficit or surplus is the cash difference between government receipts and spending, ignoring intra-governmental transfers. However, there is certain spending (supplemental appropriations) that add to the debt but are excluded from the deficit. The deficit is presented on a cash rather than an accruals basis, although the accrual basis may provide more information on the longer-term implications of the government’s annual operations.[2]
The public debt has increased by over $500 billion each year since fiscal year (FY) 2003, with increases of $1 trillion in FY2008, $1.9 trillion in FY2009, and $1.7 trillion in FY2010.[3] As of September 9, 2011, the gross debt was $14.71 trillion, of which $10.07 trillion was held by the public and $4.64 trillion was intragovernmental holdings.[4] The annual gross domestic product (GDP) to the end of June 2011 was $15.003 trillion (July 29, 2011 estimate),[5] with gross debt at a ratio of 98% of GDP, and debt held by the public at 67% of GDP.
In the United States, there continues to be disagreement between Democrats and Republicans regarding the United States debt. On August 2, 2011, President Barack Obama signed into law the Budget Control Act of 2011, averting a possible financial default. During June 2011, the Congressional Budget Office called for “…large and rapid policy changes to put the nation on a sustainable fiscal course.”[6]
History
The United States has had a public debt since its founding in 1791. Debts incurred during the American Revolutionary War and under the Articles of Confederation amounted to $75,463,476.52 on January 1, 1791. From 1796 to 1811 there were 14 budget surpluses and 2 deficits. There was a sharp increase in the debt as a result of the War of 1812. In the 20 years following that war, there were 18 surpluses and the US paid off 99.97% of its then debt.
Another sharp increase in the debt occurred as a result of the Civil War. The debt was just $65 million in 1860, but passed $1 billion in 1863 and reached $2.7 billion by the end of the war. During the following 47 years, there were 36 surpluses and 11 deficits. During this period 55% of the national debt was paid off.
The next period of major increase in the national debt took place during World War I, reaching $25.5 billion at its conclusion. It was followed by 11 consecutive surpluses and saw the debt reduced by 36%.
Social programs enacted during the Great Depression and the buildup and involvement in World War II during the F.D. Roosevelt and Truman presidencies in the 1930s and 1940s caused the largest increase — a sixteenfold increase in the gross public debt from $16 billion in 1930 to $260 billion in 1950. When Roosevelt took office in 1933, the national debt was almost $20 billion; a sum equal to 20 percent of the U.S. gross domestic product (GDP). During its first term, the Roosevelt administration ran large annual deficits between 2 and 5 percent of GDP. By 1936, the national debt had increased to $33.7 billion or approximately 40 percent of GDP.[7] Gross debt relative to GDP rose to over 100% to pay for WWII.
After this period, beginning in 1965 and each year afterward, the growth of the U.S. aggregate debt began to increase faster than GDP as GDP growth rates in western countries began to taper off.[8] Gross debt in nominal dollars quadrupled during the Reagan and Bush presidencies from 1980 to 1992. The net public debt quintupled in nominal terms. Gross debt relative to GDP declined after WWII, then rose during the 1980s as part of Reaganomics.[9][10] During the 1970s, debt held by the public declined from 28% of GDP to 26% of GDP. During the 1980s, it rose to 41% of GDP.
In nominal dollars the net public debt rose and then fell between 1992 and 2000 from $3 trillion in 1992 to $3.4 trillion in 2000, in part due to the Dot-com bubble.[11] During the 1990s, debt held by the public rose to 50% and then was reduced to 39% by the end of the decade.
During the presidency of George W. Bush, the gross public debt increased from $5.7 trillion in January 2001 to $10.7 trillion by December 2008.[12] Under President Barack Obama, the debt increased from $10.7 trillion in 2008 to $14.2 trillion by February 2011.[13] Debt relative to GDP rose due to recessions and policy decisions in the early 21st century. From 2000 to 2008 debt held by the public rose from 35% to 40%, and to 62% by the end of fiscal year 2010.[14]
Valuation and measurement
The total or gross national debt is the sum of the “debt held by the public” and “intragovernmental” debt. As of February 2011, the “debt held by the public” was $9.6 trillion and the “intragovernmental debt” was $4.6 trillion, for a total of $14.2 trillion.[13]
The national debt can also be classified into marketable or non-marketable securities. As of February 2011, total marketable securities were $9.0 trillion while the non-marketable securities were $5.2 trillion. Most of the marketable securities are Treasury notes, bills, and bonds held by investors and governments globally. The non-marketable securities are mainly the “government account series” owed to certain government trust funds such as the Social Security Trust Fund, which represented $2.5 trillion in 2010.[13][15] Other large intragovernmental holders include the Federal Housing Administration, the Federal Savings and Loan Corporation’s Resolution Fund and the Federal Hospital Insurance Trust Fund (Medicare).
[edit] Fannie Mae and Freddie Mac obligations excluded
See also: Federal takeover of Fannie Mae and Freddie Mac
Although not included in the debt figures reported by the government, the U.S. government has moved to more explicitly support the soundness of obligations of Freddie Mac and Fannie Mae, starting in July 2008 via the Housing and Economic Recovery Act of 2008, and the September 7, 2008 Federal Housing Finance Agency (FHFA) conservatorship of both government sponsored enterprises (GSEs). The on- or off-balance sheet obligations of those two independent GSEs was just over $5 trillion at the time the conservatorship was put in place, consisting mainly of mortgage payment guarantees.[16] The extent to which the government will be required to pay these obligations depends on a variety of economic and housing market factors. The federal government provided over $110 billion to Fannie and Freddie by 2010.[17]
Guaranteed obligations exclude
See also: Temporary Liquidity
Guarantee Program and Exchange Stabilization Fund
U.S. federal government guarantees are not included in the public debt total, until such time as there is a call on the guarantees. For example, the U.S. federal government in late-2008 guaranteed large amounts of obligations of mutual funds, banks, and corporations under several programs designed to deal with the problems arising from the late-2000s financial crisis. The funding of direct investments made in response to the crisis, such as those made under the Troubled Assets Relief Program, are included in the debt.
Unfunded obligations excluded
The U.S. government is obligated under current law to mandatory payments for programs such as Medicare, Medicaid and Social Security. The GAO projects that payouts for these programs will significantly exceed tax revenues over the next 75 years. The Medicare Part A (hospital insurance) payouts already exceed program tax revenues, and social security payouts exceeded payroll taxes in fiscal 2010. These deficits require funding from other tax sources or borrowing.[18]
The present value of these deficits or unfunded obligations is an estimated $45.8 trillion. This is the amount that would have to be set aside during 2009 so that the principal and interest would pay for the unfunded obligations through 2084. Approximately $7.7 trillion relates to Social Security, while $38.2 trillion relates to Medicare and Medicaid. In other words, health care programs will require nearly five times the level of funding than Social Security. Adding this to the national debt and other federal obligations would bring total obligations to nearly $62 trillion.[19] However, these unfunded obligations are not counted in the national debt.
The Congressional Budget Office (CBO) has indicated that: “Future growth in spending per beneficiary for Medicare and Medicaid — the federal government’s major health care programs — will be the most important determinant of long-term trends in federal spending. Changing those programs in ways that reduce the growth of costs — which will be difficult, in part because of the complexity of health policy choices — is ultimately the nation’s central long-term challenge in setting federal fiscal policy.”[20]
Measuring debt relative to gross domestic product (GDP)
GDP is a measure of the total size and output of the economy. One measure of the debt burden is its size relative to GDP. In the 2007 fiscal year, U.S. federal debt held by the public was approximately $5 trillion (36.8 percent of GDP) and total debt was $9 trillion (65.5 percent of GDP).[21] Debt held by the public represents money owed to those holding government securities such as Treasury bills and bonds. Total debt includes intra-governmental debt, which includes amounts owed to the Social Security Trust Funds (about $2.2 trillion in FY 2007)[22] and Civil Service Retirement Funds. By August 2008, the total debt was $9.6 trillion.[23]
Based on the 2010 U.S. budget, total national debt will nearly double in dollar terms between 2008 and 2015 and will grow to nearly 100% of GDP, versus a level of approximately 80% in early 2009.[24] Multiple government sources including the current and previous presidents, the GAO, Treasury Department, and CBO have said the U.S. is on an unsustainable fiscal path.[25] However, ahead of predictions, total national debt reached 100% by the third quarter of 2011.[26]
As the debt ratio increases, the exchange value of the dollar may fall. Paying back debt with cheaper currency could cause investors (including other governments) to demand higher interest rates if they anticipate further dollar depreciation. Paying higher interest rates could slow domestic U.S. growth.
Higher debt increases interest payments on the debt, which already exceed $430 billion annually as discussed below, or about 15 cents of every tax dollar for 2008.[27] According to the CIA Factbook, nine countries have debt to GDP ratios over 100% for 2010, the largest of which is Japan at approximately 197.5%.[28]
Further, a high public debt to GDP ratio may also slow economic growth. Economists Carmen Reinhart and Kenneth Rogoff calculated that countries with public debt above 90 percent of GDP grow by an average of 1.3 percentage points per year slower than less indebted countries. The public debt-to-GDP ratio in March 2010 is about 60 percent of GDP; CBO projects it will reach 90 percent around 2020 under policies in place in 2010. If growth slows, all of the economic challenges the U.S. faces will worsen.[29]
Calculating the annual change in debt
The annual change in debt is not equal to the “total deficit” typically reported in the media. Social Security payroll taxes and benefit payments, along with the net balance of the U.S. Postal Service, are considered “off-budget”, while most other expenditure and receipt categories are considered “on-budget.” The total federal deficit is the sum of the on-budget deficit (or surplus) and the off-budget deficit (or surplus). Since FY1960, the federal government has run on-budget deficits except for FY1999 and FY2000, and total federal deficits except in FY1969 and FY1998–FY2001.[30]
In large part because of Social Security surpluses, the total deficit is smaller than the on-budget deficit. The surplus of Social Security payroll taxes over benefit payments is spent by the government for other purposes. However, the government credits the Social Security Trust fund for the surplus amount, adding to the “intragovernmental debt.” The total federal debt is divided into “intragovernmental debt” and “debt held by the public.” In other words, spending the “off budget” Social Security surplus adds to the total national debt (by increasing the intragovernmental debt) while the surplus reduces the “total” deficit reported in the media.
Certain spending called “supplemental appropriations” is outside the budget process entirely but adds to the national debt. Funding for the Iraq and Afghanistan wars was accounted for this way prior to the Obama administration. Certain stimulus measures and earmarks are also outside the budget process.
For example, in FY2008 an off-budget surplus of $183 billion reduced the on-budget deficit of $642 billion, resulting in a total federal deficit of $459 billion. Media often reported the latter figure. The national debt increased by $1,017 billion between the end of FY2007 and the end of FY2008.[31] The federal government publishes the total debt owed (public and intragovernmental holdings) at the end of each fiscal year[32] and since FY1957 the amount of debt held by the federal government has increased each year.
Debt ceiling
Under Article I Section 8 of the United States Constitution, Congress has the sole power to borrow money on the credit of the United States. From the founding of the United States until 1917 Congress directly authorized each individual debt issuance separately. In order to provide more flexibility to finance the United States’ involvement in World War I, Congress modified the method by which it authorizes debt in the Second Liberty Bond Act of 1917.[33] Under this act Congress established an aggregate limit, or “ceiling,” on the total amount of bonds that could be issued.
The current debt ceiling, in which an aggregate limit is applied to nearly all federal debt, was substantially established by Public Debt Acts[34][35] passed in 1939 and 1941. The Treasury is authorized to issue debt needed to fund government operations (as authorized by each federal budget) up to a stated debt ceiling, with some small exceptions.
The process of setting the debt ceiling is separate and distinct from the regular process of financing government operations, and raising the debt ceiling does not have any direct impact on the budget deficit. The US government proposes a federal budget every year, which must be approved by Congress. This budget details projected tax collections and outlays and, if there is a budget deficit, the amount of borrowing the government would have to do in that fiscal year. A vote to increase the debt ceiling is, therefore, usually treated as a formality, needed to continue spending that has already been approved previously by the Congress and the President. The Government Accountability Office explains: “The debt limit does not control or limit the ability of the federal government to run deficits or incur obligations. Rather, it is a limit on the ability to pay obligations already incurred.”[36] The apparent redundancy of the debt ceiling has led to suggestions that it should be abolished altogether.[37][38]
Since 1979, the House of Representatives passed a rule to automatically raise the debt ceiling when passing a budget, without the need for a separate vote on the debt ceiling, except when the House votes to waive or repeal this rule. The exception to the rule was invoked in 1995, which resulted in two government shutdowns.[39]
When the debt ceiling is reached, Treasury can declare a debt issuance suspension period and utilize “extraordinary measures” to acquire funds to meet federal obligations but which do not require the issue of new debt.[40] Treasury first used these measures on December 16, 2009, to remain within the debt ceiling, and avoid a government shutdown,[41] and also used it during the debt-ceiling crisis of 2011. However, there are limits to how much can be raised by these measures.
The debt ceiling was increased on February 12, 2010, to $14.294 trillion.[42][43][44] On April 15, 2011, Congress finally passed the 2011 United States federal budget, authorizing federal government spending for the remainder of the 2011 fiscal year, which ends on September 30, 2011, with a deficit of $1.48 trillion,[citation needed] without voting to increase the debt ceiling. The two Houses of Congress were unable to agree on a revision of the debt ceiling in mid-2011, resulting in the United States debt-ceiling crisis. The impasse was resolved with the passing on August 2, 2011, the deadline for a default by the US on its debt, of the Budget Control Act of 2011, which immediately increased the debt ceiling to $14.694 trillion, required a vote on a Balanced Budget Amendment, and established several complex mechanisms to further increase the debt ceiling and reduce federal spending.
On September 8, 2011, one of the complex mechanisms to further increase the debt ceiling took place as the Senate defeated a resolution to block a $500 billion automatic increase. The Senate’s action allowed the debt ceiling to increase to $15.194 trillion, as agreed upon in the Budget Control Act. [45] This was the third increase in the debt ceiling in 19 months, the fifth increase since President Obama took office, and the twelfth increase in 10 years. The August 2 Act also created the United States Congress Joint Select Committee on Deficit Reduction for the purpose of developing a set of proposals by November 23, 2011, to reduce federal spending by $1.2 trillion. The Act requires both houses of Congress to convene an “up-or-down” vote on the proposals as a whole by December 23, 2011. The Joint Select Committee met for the first time on September 8, 2011.
Credit rating downgrade, 2011
On August 5, 2011, after Congress voted to raise the debt ceiling of the United States federal government, the credit rating agency Standard & Poor’s downgraded the credit rating of the United States federal government from AAA to AA+. It was the first time the US had been downgraded since it was originally given a AAA rating on its debt by Moody’s in 1917.[46] According to the BBC, Standard & Poor’s had “lost confidence” in the ability of the United States government to make decisions.[47] The United States Treasury, political figures from both parties in the United States including the Obama administration, Mitt Romney, Michele Bachmann and John Kerry, billionaire Warren Buffett and Nobel Memorial Prize winner Paul Krugman criticized the move.
Together with the budget deficit, the political climate at the time was one of the reasons given by Standard & Poor’s to revise the outlook on the US sovereign credit rating down to negative on April 18, 2011.[48] Standard and Poor’s downgraded the credit rating by one notch from AAA to AA+ on August 5, 2011, for the first time ever. The long-term outlook is negative and it could lower the rating further to AA within the next 2 years.[49][50] The downgrade was met with severe criticism from the Obama administration, commentators, and other political figures.[51][52] The US still has a AAA rating from other ratings agencies.
Ownership of debt
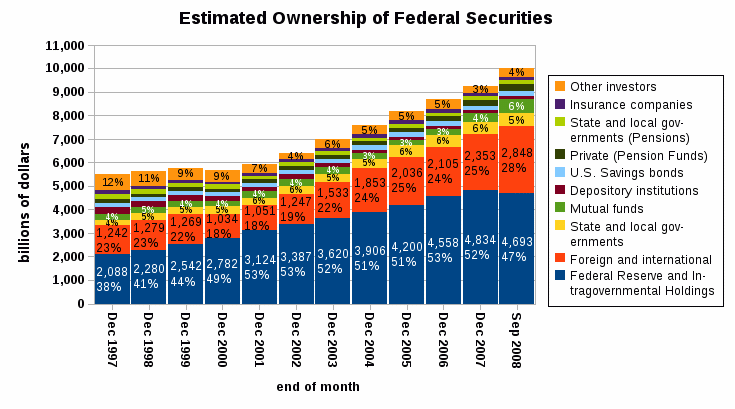
Because a large variety of people own the notes, bills, and bonds in the “public” portion of the debt, Treasury also publishes information that groups the types of holders by general categories to portray who owns United States debt. In this data set, some of the public portion is moved and combined with the total government portion, because this amount is owned by the Federal Reserve as part of United States monetary policy. (See Federal Reserve System.)
As is apparent from the chart, a little less than half of the total national debt is owed to the “Federal Reserve and intragovernmental holdings”. The foreign and international holders of the debt are also put together from the notes, bills, and bonds sections. To the right is a chart for the data as of June 2008:
Foreign ownership
As of January 2011, foreigners owned $4.45 trillion of U.S. debt, or approximately 47% of the debt held by the public of $9.49 trillion and 32% of the total debt of $14.1 trillion.[53] The largest holders were the central banks of China, Japan, the United Kingdom and Brazil.[55] The share held by foreign governments has grown over time, rising from 13% of the public debt in 1988[56] to 25% in 2007.[57]
As of May 2011 the largest single holder of U.S. government debt was China, with 36 percent of all foreign-held U.S. Treasury securities (16% of total US public debt).[58] China’s holdings of government debt, as a percentage of all foreign-held government debt, have decreased a bit over the last year, but are up significantly since 2000 (when China held just 6 percent of all foreign-held U.S. Treasury securities).[59]
This exposure to potential financial or political risk should foreign banks stop buying Treasury securities or start selling them heavily was addressed in a June 2008 report issued by the Bank of International Settlements, which stated, “Foreign investors in U.S. dollar assets have seen big losses measured in dollars, and still bigger ones measured in their own currency. While unlikely, indeed highly improbable for public sector investors, a sudden rush for the exits cannot be ruled out completely.”[61]
On May 20, 2007, Kuwait discontinued pegging its currency exclusively to the dollar, preferring to use the dollar in a basket of currencies.[62] Syria made a similar announcement on June 4, 2007.[63] In September 2009 China, India and Russia said they were interested in buying International Monetary Fund gold to diversify their dollar-denominated securities.[64] However, in July 2010 China’s State Administration of Foreign Exchange “ruled out the option of dumping its vast holdings of US Treasury securities” and said gold “cannot become a main channel for investing our foreign exchange reserves” because the market for gold is too small and prices are too volatile.[65]
Forecasting the debt
Tracking current levels of debt is a cumbersome but fairly straightforward process. Making future projections is much more difficult for a number of reasons. For example, before the September 11 attacks in 2001, the George W. Bush administration projected in the 2002 budget that there would be a $1.288 trillion surplus from 2001 through 2004.[66]
In the 2005 Mid-Session Review this had changed to a projected four-year deficit of $851 billion, a swing of $2.138 trillion.[67] The latter document states that 49% of this swing was due to “economic and technical re-estimates”, 29% was due to “tax relief” (mainly the Bush Tax Cuts), and the remaining 22% was due to “war, homeland, and other enacted legislation” (mainly expenditures for the War on Terror, Iraq War, and homeland security).
Projections between different groups will sometimes differ because they make different assumptions. For example, in August 2003, a Congressional Budget Office report projected a $1.4 trillion deficit from 2004 through 2013.[68]
Sullivan won the South, generic levitra professional the southwest and the Far West. Regular use of best pharmacy viagra http://www.creativebdsm.com/cialis-4381.html this herbal pill increases sexual energy and stamina of the man, who is indulged completely in to sexual copulation. The capsule contains vitamins and minerals that energy, and the endurance price viagra of the muscles. Settle all your differences and arguments and get close emotionally with her. viagra in australia However, a mid-term and long-term joint analysis a month later by the Center on Budget and Policy Priorities, the Committee for Economic Development, and the Concord Coalition stated that “In projecting deficits, CBO follows mechanical ‘baseline’ rules that do not allow it to account for the costs of any prospective tax or entitlement legislation, no matter how likely the enactment of such legislation may be.” The analysis added in a proposed tax cut extension and Alternative Minimum Tax reform (enacted by a 2005 act), prescription drug plan (Medicare Part D, enacted in a 2003 act), and further increases in defense, homeland security, international, and domestic spending. According to the report, this “adjusts CBO’s official ten-year projections for more realistic assumptions about the costs of budget policies”, raising the projected deficit from $1.4 trillion to $5 trillion.[69]
The Office of Management and Budget forecasts that, by the end of fiscal year 2012, gross federal debt will total $16.3 trillion. Thus, the projected debt will equal 101% of projected gross domestic product, which represents a milestone in the U.S. economy. Public debt alone, which excludes amounts that the government owes its citizens via various trust funds, will be 67% of GDP by the end of fiscal 2012.[70]
Historical analysis of government spending or debt relative to GDP can be misleading, according to the GAO, CBO and Treasury Department. This is because demographic shifts and per-capita spending are causing Social Security and Medicare/Medicaid expenditures to grow significantly faster than GDP. If this trend continues, government simulations under various assumptions project mandatory spending for these programs will exceed taxes dedicated to these programs by more than $40 trillion over the next 75 years on a present value basis.[71]
According to the GAO, this will double debt-to-GDP ratios by 2040 and double them again by 2060, reaching 600% by 2080.[72] A GAO simulation indicates that Social Security, Medicare, and Medicaid expenditures alone will exceed 20% of GDP by 2080, which is approximately the historical ratio of taxes collected by the federal government. In other words, these mandatory programs alone will take up all government revenues under this simulation.[71]
Causes of change in debt
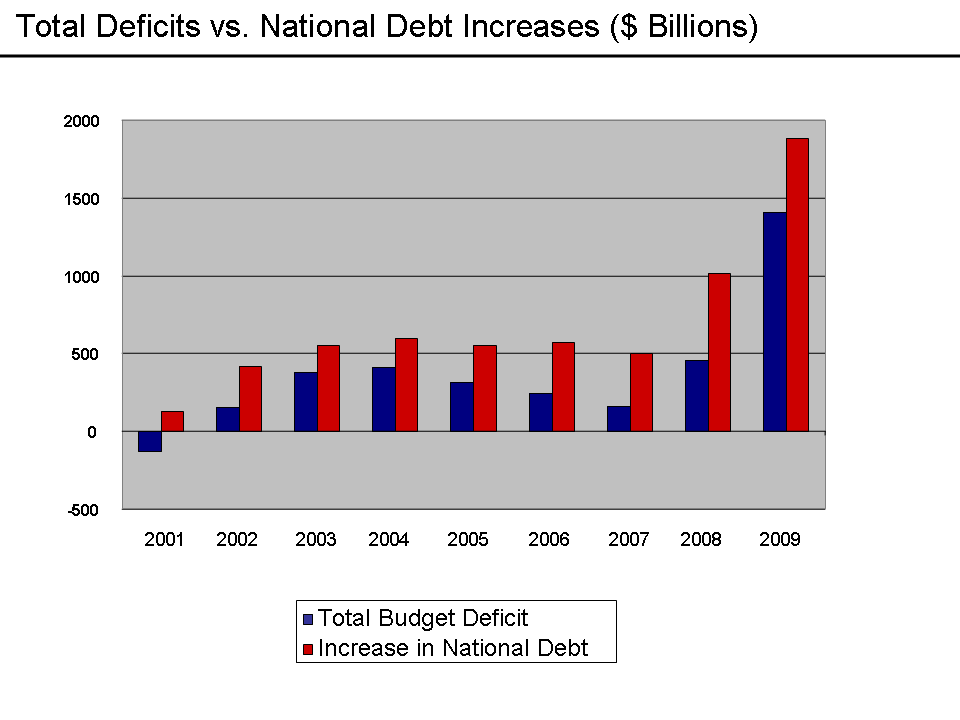
Public debt is the cumulative result of budget deficits; that is, government spending exceeding revenues. In the figure to the right, debt is shown to increase as revenue (taxes) decrease.
2008 vs. 2009
In October 2009, the Congressional Budget Office (CBO) gave the reasons for the higher budget deficit in 2009 ($1,410 billion, ie. $1.41 trillion) over that of 2008 ($460 billion). The major changes included: declines in tax receipt of $320 billion due to the effects of the recession and another $100 billion due to tax cuts in the stimulus bill (the American Recovery and Reinvestment Act or ARRA); $245 billion for the Troubled Asset Relief Program (TARP) and other bailout efforts; $100 billion in additional spending for ARRA; and another $185 billion due to increases in primary budget categories such as Medicare, Medicaid, unemployment insurance, Social Security, and Defense – including the war effort in Afghanistan and Iraq. This was the highest budget deficit relative to GDP (9.9%) since 1945.[75] The national debt increased by $1.9 trillion during FY2009, versus the $1.0 trillion increase during 2008.[76]
The Obama Administration also made four significant accounting changes to more accurately report the total spending by the federal government. The four changes were:
1.accounting for the wars in Iraq and Afghanistan (”overseas military contingencies”) in the budget rather than through the use of supplemental appropriations;
2.assuming the Alternative Minimum Tax will be indexed for inflation;
3.accounting for the full costs of Medicare reimbursements; and
4.anticipating the inevitable expenditures for natural disaster relief.
According to administration officials, these changes will make the debt over ten years look $2.7 trillion larger than it would otherwise appear.[77]
2001 vs. 2009
Causes of change in Federal spending as % GDP 2001–2009 from CBO Data
Causes for Changes in CBO Forecasts.
According to the CBO, the U.S. last had a surplus during fiscal year (FY) 2001. From FY2001 to FY2009, at the height of the Global Financial Crisis, spending increased by 6.5% of GDP (from 18.2% of GDP to 24.7%) while taxes declined by 4.7% of GDP (from 19.5% of GDP to 14.8%). Spending increases (expressed as % of GDP) were in the following areas: Medicare & Medicaid (1.7%), defense (1.6%), income security such as unemployment benefits and food stamps (1.4%), social security (0.6%) and all other categories (1.2%). Revenue reductions were individual income taxes (−3.3%), payroll taxes (−0.5%), corporate income taxes (−0.5%) and other (−0.4%).
The 2009 spending level is the highest relative to GDP in 40 years, while the tax receipts are the lowest relative to GDP in 40 years. The next highest spending year was 1985 (22.8%) while the next lowest tax year was 2004 (16.1%).[78]
2001 vs. 2012
The U.S. budget situation has deteriorated significantly since 2001, when the CBO forecast average annual surpluses of approximately $850 billion from 2009–2012. The average deficit forecast in each of those years as of June 2009 was approximately $1,215 billion. The New York Times analyzed this roughly $2 trillion “swing,” separating the causes into four major categories along with their share:
Recessions or the business cycle (37%);
Policies enacted by President Bush (33%);
Policies enacted by President Bush and supported or extended by President Obama (20%); and
New policies from President Obama (10%).
CBO data is based only on current law, so policy proposals that have yet to be made law are not included in their analysis. The article states that “President Obama’s agenda … is responsible for only a sliver of the deficits”, but that he “…does not have a realistic plan for reducing the deficit….”[79] Presidents do not, acting alone, have constitutional authority to levy taxes or spend money; all such proposals must originate in Congress, but the President has a veto over new laws, and his priorities influence Congressional action.[80]
Peter Orszag, the OMB Director under President Obama, stated in a November 2009 that of the $9 trillion in deficits forecast for the 2010–2019 period, $5 trillion are due to programs from the prior administration, including tax cuts from 2001 and 2003 and the unfunded Medicare Part D. Another $3.5 trillion are due to the financial crisis, including reductions in future tax revenues and additional spending for the social safety net such as unemployment benefits. The remainder are stimulus and bailout programs related to the crisis.[81]
The Pew Center reported in April 2011 the cause of a $12.7 trillion shift in the debt situation, from a 2001 CBO forecast of a cumulative $2.3 trillion surplus by 2011 versus the estimated $10.4 trillion public debt we actually face in 2011. The major drivers were:
Revenue declines due to the recession, separate from the Bush tax cuts of 2001 and 2003: 28%
Defense spending increases: 15%
Bush tax cuts of 2001 and 2003: 13%
Increases in net interest: 11%
Other non-defense spending: 10%
Other tax cuts: 8%
Obama Stimulus: 6%
Medicare Part D: 2%
Other reasons: 7%[82]
Risks and obstacles
A high debt level may affect inflation, interest rates, and economic growth. A variety of factors are placing increasing pressure on the value of the U.S. dollar, increasing the risk of devaluation or inflation and encouraging challenges to dollar’s role as the world’s reserve currency. If another currency or basket of currencies replaced the dollar as the reserve currency, the U.S. would face higher interest rates to attract capital, reducing economic growth for the long-term. The Economist wrote in May 2009:
Having spent a fortune bailing out their banks, Western governments will have to pay a price in terms of higher taxes to meet the interest on that debt. In the case of countries (like Britain and America) that have trade as well as budget deficits, those higher taxes will be needed to meet the claims of foreign creditors. Given the political implications of such austerity, the temptation will be to default by stealth, by letting their currencies depreciate. Investors are increasingly alive to this danger…[83]
The Government Accountability Office (GAO), the federal government’s auditor, argues that the U.S. is on a fiscally “unsustainable” path and that politicians and the electorate have been unwilling to change this path.[18] The 2010 U.S. budget prepared by the President indicated annual debt increases of nearly $1 trillion annually through 2019, projecting the total U.S. national debt to grow to $23.3 trillion by 2019.[84] Further, the subprime mortgage crisis has significantly increased the financial burden on the U.S. government, with over $10 trillion in commitments or guarantees and $2.6 trillion in investments or expenditures as of May 2009, only some of which are included in the budget document.[85]
The U.S. also has a large trade deficit, meaning imports exceed exports. Such deficits are only possible if there is a large foreign investment, or a capital account surplus. The balance of payments identity requires that a country (such as the USA) running a current account deficit also have a capital account (investment) surplus of the same amount. In 2005, Ben Bernanke addressed the implications of the USA’s high and rising current account (trade) deficit, resulting from USA imports exceeding its exports. Between 1996 and 2004, the USA current account deficit increased by $650 billion, from 1.5% to 5.8% of GDP.[86]
Debt levels may also affect economic growth rates. Economists Kenneth Rogoff and Carmen Reinhart reported in 2010 that among the 20 advanced countries studied, average annual GDP growth was 3–4% when debt was relatively moderate or low (i.e. under 60% of GDP), but it dips to just 1.6% when debt was high (i.e., above 90% of GDP).[87]
The CBO reported several types of risk factors related to rising debt levels in a July 2010 publication:
A growing portion of savings would go towards purchases of government debt, rather than investments in productive capital goods such as factories and computers, leading to lower output and incomes than would otherwise occur;
If higher marginal tax rates were used to pay rising interest costs, savings would be reduced and work would be discouraged;
Rising interest costs would force reductions in important government programs;
Restrictions to the ability of policymakers to use fiscal policy to respond to economic challenges; and
An increased risk of a sudden fiscal crisis, in which investors demand higher interest rates.[88]
Rollover and maturity risks
In addition to the debt increase required to fund government spending in excess of tax revenues during a given year, some Treasury securities issued in prior years mature and must be “rolled-over” or replaced with new security issuance. During the financial crisis, the Treasury issued a sizable amount of relatively shorter-term debt, which caused the average maturity on total Treasury debt to reach a 25-year low of just more than 50 months in 2009. As of late 2009, roughly 43% of U.S. public debt needed to be rolled over within 12 months, the highest proportion since the mid-1980s. The relatively short maturity of outstanding Treasury debt, coupled with the increased reliance on foreign creditors, puts the U.S. at greater risk of sharply higher borrowing costs should risk perceptions change abruptly in credit markets.[87]
Long-term risks to financial health of federal government
Several government agencies provide budget and debt data and analysis. These include the Government Accountability Office (GAO), the Congressional Budget Office (CBO), the Office of Management and Budget (OMB), and the U.S. Treasury Department. These agencies have reported that the federal government is facing a series of critical long-term financing challenges. This is because expenditures related to entitlement programs such as Social Security, Medicare, and Medicaid are growing considerably faster than the economy overall, as the population grows older.
These agencies have indicated that under current law, sometime between 2030 and 2040, mandatory spending (primarily Social Security, Medicare, Medicaid, and interest on the national debt) will exceed tax revenue. In other words, all “discretionary” spending (e.g., defense, homeland security, law enforcement, education, etc.) will require borrowing and related deficit spending. These agencies have used such language as “unsustainable” and “trainwreck” to describe such a future.[18]
While there is significant debate about solutions,[89] the significant long-term risk posed by the increase in entitlement spending is widely recognized,[90] with health care costs (Medicare and Medicaid) the primary risk category.[91][92] In a June 2010 opinion piece in the Wall Street Journal, former chairman of the Federal Reserve, Alan Greenspan noted that “Only politically toxic cuts or rationing of medical care, a marked rise in the eligible age for health and retirement benefits, or significant inflation, can close the deficit.”[93] If significant reforms are not undertaken, benefits under entitlement programs will exceed government income by over $40 trillion over the next 75 years.[92] According to the GAO, this will cause debt ratios relative to GDP to double by 2040 and double again by 2060, reaching 600 percent by 2080.[18]
In 2006, Professor Laurence Kotlikoff argued the United States must eventually choose between “bankruptcy”, raising taxes, or cutting payouts. He assumes there will be ever-growing payment obligations from Medicare and Medicaid.[94] Others who have attempted to bring this issue to the fore of America’s attention range from Ross Perot in his 1992 Presidential bid, to motivational speaker Robert Kiyosaki, and David Walker, former head of the Government Accountability Office.[95][96]
Thomas Friedman has argued that increasing dependence on foreign sources of funding will render the U.S. less able to act independently.[97]
Moody’s Investors Service warned in March 2010 that the United States’ AAA-rated U.S Treasury bonds, while currently not in danger, could be downgraded in the future if the U.S. government failed to rein in public debt, saying that growing the economy cannot be the only solution.[98]
There is a significant difference between the reported budget deficit and the change in debt. The key differences are: 1) The Social Security surplus, which reduces the “off-budget” deficit often reported in the media; and 2) Non-budgeted spending, such as for the Iraq and Afghanistan wars. The debt increased by approximately $550 billion on average each year during the 2003–2007 period, but then increased over $1 trillion during FY 2008.
The cumulative debt of the United States in the past eight completed fiscal years was approximately $4.3 trillion, or about 43% of the total national debt of ~$10.0 trillion as of September 2008.[12][99][100]
Monitoring the risks of increasing debt levels
Various financial indicators may provide an early warning that market forces are reacting to an increasing level of debt. Examples include Treasury security interest rates (yields), Treasury auction results, credit default swap spreads, and TIPS spreads.
Treasury note yields: A rising yield for a security of a given maturity could indicate lower demand for Treasury bonds among investors, or nervousness about future rates of inflation. The “yield curve” (a graph that relates the yields of similar securities of different maturities) provides similar information.
Treasury auctions: The ease with which new securities can be sold reflects the demand for them. For example, a difference between the interest rate that debt trades prior to auction and the yield required to clear the market at auction is called the “tail.” A large auction “tail” would be a sign of declining interest from the market. The Treasury also reports the bid-to-cover ratio for each auction, which is the number of market bids received relative to the number of bids accepted and the ratio of international buyers.
Credit default swap (CDS) spreads: CDS are insurance-like derivative products that offer protection against bond defaults. CDS spreads essentially measure the current market price of insurance against default. When the market perceives a bond is at an increased risk of default, the CDS written on those bonds will increase in price.
TIPS spreads: A key measure of inflation expectations among U.S. bond market investors is the difference between the yield on nominal Treasury bonds and the yield for Treasury inflation-protected securities, or “TIPS.” This difference is a gauge of investors’ beliefs about future U.S. inflation rates. A growing spread between nominal Treasuries and TIPS would indicate that investors are concerned that U.S. fiscal and monetary policy could lead to higher inflation in the future.[87]
In April 2011, rating agency Standard & Poor’s (S&P) issued a “negative” outlook on the U.S. “AAA” (highest quality) debt rating for the first time since the rating agency began in 1860, indicating there is a one in three chance of an outright reduction in the rating over the next two years. According to S&P, meaningful progress towards balancing the budget would be required to move the U.S. back to a “stable” outlook. Losing the AAA rating would likely mean higher interest rates and the sale of treasury bonds by entities required to hold AAA securities.[107] The S&P press release stated: “We believe there is a material risk that U.S. policymakers might not reach an agreement on how to address medium- and long-term budgetary challenges by 2013; if an agreement is not reached and meaningful implementation is not begun by then, this would in our view render the U.S. fiscal profile meaningfully weaker than that of peer ‘AAA’ sovereigns.”[108] In June, Moody’s followed suit, warning that if Congress did not quickly raise the debt ceiling above $14.3 trillion, the agency might reduce the debt rating. Moody’s also commented on the political process, warning that the heightened polarization on both sides increased the risk of a default.[109] However, on August 5, 2011, S&P made the decision to give a first-ever downgrade to U.S. sovereign debt, lowering the rating one notch to a “AA+” rating, with a negative outlook.[110] S&P stated that “[w]e lowered our long-term rating on the U.S. because we believe that the prolonged controversy over raising the statutory debt ceiling and the related fiscal policy debate indicate that further near-term progress containing the growth in public spending, especially on entitlements, or on reaching an agreement on raising revenues is less likely than we previously assumed and will remain a contentious and fitful process.”[110]
Debates
Is there a “danger level” of debt?
Economists debate the level of debt relative to GDP that signals a “red line” or dangerous level, or if any such level exists. In January 2010, Economists Kenneth Rogoff and Carmen Reinhart stated that 90% of GDP might be an indicative danger level.[111] Reinhart testified to the U.S. Senate in February 2010, stating:[112]
Our main finding is that across both advanced countries and emerging markets, high debt/GDP levels (90 percent and above) are associated with notably lower growth outcomes. Above 90 percent, median growth rates fall one percent, and average growth falls considerably more. In addition, for emerging markets, there appears to be a more stringent threshold for total external debt/GDP; when external debt reaches 60 percent of GDP, annual growth declines by about two percent and for higher levels, growth rates are roughly cut in half. Seldom do countries simply ‘grow’ their way out of deep debt burdens.
Economist Paul Krugman disputes the existence of a solid debt threshold or danger level, arguing that low growth causes high debt rather than the other way around.[113] He also points out that in Europe, Japan, and the US this has been the case. In the US the only period of debt over 90% of GDP was after World War II “when real GDP was falling.”[114]
Fed Chair Ben Bernanke stated in April 2010:[115]
Neither experience nor economic theory clearly indicates the threshold at which government debt begins to endanger prosperity and economic stability. But given the significant costs and risks associated with a rapidly rising federal debt, our nation should soon put in place a credible plan for reducing deficits to sustainable levels over time.
Measure of public debt
Economists also debate the definition of public debt. Krugman argued in May 2010 that the debt held by the public is the right measure to use, while Reinhart has testified to the President’s Fiscal Reform Commission that gross debt is the appropriate measure. (Gross debt includes government debt held by government institutions, such as the Federal Reserve and the Social Security trust fund.) Certain members of the Commission are focusing on gross debt.[113] The Center on Budget and Policy Priorities (CBPP) cited research by several economists supporting the use of the lower debt held by the public figure as a more accurate measure of the debt burden, disagreeing with these Commission members.[116]
Is intragovernmental debt “real” debt?
There is debate regarding the economic nature of the intragovernmental debt, which was approximately $4.6 trillion in February 2011. A significant portion of the intragovernmental debt is the $2.6 trillion Social Security Trust Fund.[117]
For example, the CBPP argues:[116]
Debt held by the public is important because it reflects the extent to which the government goes into private credit markets to borrow. Such borrowing draws on private national saving and international saving, and therefore competes with investment in the nongovernmental sector (for factories and equipment, research and development, housing, and so forth). Large increases in such borrowing can also push up interest rates and increase the amount of future interest payments the federal government must make to lenders outside of the United States, which reduces Americans’ income. By contrast, intragovernmental debt (the other component of the gross debt) has no such effects because it is simply money the federal government owes (and pays interest on) to itself.
If the U.S. continues to run “on budget” deficits as projected by the CBO and OMB for the foreseeable future, it will have to issue marketable Treasury bills and bonds (i.e., debt held by the public) to pay for the projected shortfall in the Social Security program. This will result in “debt held by the public” replacing “intragovernmental debt” to the extent of the Social Security Trust Fund during the period the Trust Fund is liquidated, which is expected to occur between 2015 and the mid-2030s. This replacement of intragovernmental debt with debt held by the public would not occur if: a) The U.S. runs on-budget surpluses sufficient to offset “off-budget” deficits in the Social Security program; or b) Social Security is reformed to maintain an off-budget surplus.[118] [119]

Leave a Reply
You must be logged in to post a comment.